3 Cars
For our first chapter on consumption, let’s study that icon of modern civilization: the car with a lone person in it.
How much power does a regular car-user consume? Once we know the conversion rates, it’s simple arithmetic:
[\begin{matrix} {\text{energy\ used\ per\ day} = \frac{\text{distance\ travelled\ per\ day}}{\text{distance\ per\ unit\ of\ fuel}}} \ {\times \text{energy\ per\ unit\ of\ fuel}} \ \end{matrix}]
For the distance travelled per day, let’s use 50 km (30 miles). 1
For the distance per unit of fuel, also known as the economy of the car, let’s use 33 miles per UK gallon 2 (taken from an advertisement for a family car):
[\text{33\ miles\ per\ imperial\ gallon} \simeq \text{12\ km\ per\ litre.}]
(The symbol ≃ means “is approximately equal to.“)

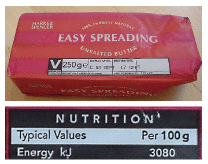
What about the energy per unit of fuel (also called the calorific value or energy density)? Instead of looking it up, it’s fun to estimate this sort of quantity by a bit of lateral thinking. Automobile fuels (whether diesel or petrol) are all hydrocarbons; and hydrocarbons can also be found on our breakfast table, with the calorific value conveniently written on the side: roughly 8 kWh per kg (figure 3.2). Since we’ve estimated the economy of the car in miles per unit volume of fuel, we need to express the calorific value as an energy per unit volume. To turn our fuel’s “8 kWh per kg” (an energy per unit mass) into an energy per unit volume, we need to know the density of the fuel. What’s the density of butter? Well, butter just floats on water, as do fuel-spills, so its density must be a little less than water’s, which is 1 kg per litre. If we guess a density of 0.8 kg per litre 3, we obtain a calorific value of:
[\text{8\ kWh\ per\ kg\ ×\ 0.8\ kg\ per\ litre} \simeq \text{7\ kWh\ per\ litre.}]
Rather than willfully perpetuate an inaccurate estimate, let’s switch to the actual value, for petrol, of 10 kWh per litre. 4
[\begin{matrix} \ {= \frac{\text{distance\ travelled\ per\ day}}{\text{distance\ per\ unit\ of\ fuel}} \times \text{energy\ per\ unit\ of\ fuel}} \ \left. = \frac{\left. \text{50\ km}/\text{day} \right.}{\left. \text{12\ km}/\text{day} \right.} \times \text{10\ kWh}/\text{litre}\phantom{\text{AAA,,}} \right. \ {\simeq \left. \text{40\ kWh}/\text{day}\phantom{\text{AAAAAAAAAAAA}} \right.} \ \end{matrix}]
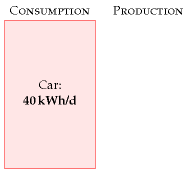
Congratulations! We’ve made our first estimate of consumption. I’ve displayed this estimate in the left-hand stack in figure 3.3. The red box’s height represents 40 kWh per day per person.
This is the estimate for a typical car-driver driving a typical car today. Later chapters will discuss the average consumption of all the people in Britain, taking into account the fact that not everyone drives. We’ll also discuss in Part II what the consumption could be, with the help of other technologies such as electric cars.

Why does the car deliver 33 miles per gallon? Where’s that energy going? Could we manufacture cars that do 3300 miles per gallon? If we are interested in trying to reduce cars’ consumption, we need to understand the physics behind cars’ consumption. These questions are answered in the accompanying technical chapter A, which provides a cartoon theory of cars’ consumption. I encourage you to read the technical chapters if formulae like (\frac{1}{2}mv^{2}) don’t give you medical problems.
Chapter 3’s conclusion: a typical car-driver uses about 40 kWh per day. Next we need to get the sustainable-production stack going, so we have something to compare this estimate with.
Queries
What about the energy-cost of producing the car’s fuel?
Good point. When I estimate the energy consumed by a particular activity, I tend to choose a fairly tight “boundary” around the activity. This choice makes the estimation easier, but I agree that it’s a good idea to try to estimate the full energy impact of an activity. It’s been estimated that making each unit of petrol requires an input of 1.4 units of oil and other primary fuels (Treloar et al., 2004).
What about the energy-cost of manufacturing the car?
Yes, that cost fell outside the boundary of this calculation too. We’ll talk about car-making in Chapter 15.

Notes and further reading
calorific values
petrol
10 kWh per litre
diesel
11 kWh per litre

- For the distance travelled per day, let’s use 50 km. This corresponds to 18 000 km (11 000 miles) per year. Roughly half of the British population drive to work. The total amount of car travel in the UK is 686 billion passenger-km per year, which corresponds to an “average distance travelled by car per British person” of 30 km per day. Source: Department for Trans- port [5647rh]. As I said in chapter 2, I aim to estimate the consumption of a “typical moderately-affluent person” – the consumption that many people aspire to. Some people don’t drive much. In this chapter, I want to estimate the energy consumed by someone who chooses to drive, rather than depersonalize the answer by reporting the UK average, which mixes together the drivers and non-drivers. If I said “the average use of energy for car driving in the UK is 24 kWh/d per person,” I bet some people would misunderstand and say: “I’m a car driver so I guess I use 24 kWh/d.”↩
- … let’s use 33 miles per UK gallon. In the European language, this is 8.6 litres per 100 km. 33 miles per gallon was the average for UK cars in 2005 [27jdc5]. Petrol cars have an average fuel consumption of 31 mpg; diesel cars, 39 mpg; new petrol cars (less than two years old), 32 mpg (Dept. for Transport, 2007). Honda, “the most fuel-efficient auto company in America,” records that its fleet of new cars sold in 2005 has an average top-level fuel economy of 35 miles per UK gallon [28abpm].↩
- Let’s guess a density of 0.8 kg per litre. Petrol’s density is 0.737. Diesel’s is 0.820–0.950 [nmn4l].↩
- … the actual value of 10 kWh per litre. ORNL [2hcgdh] provide the following calorific values: diesel: 10.7 kWh/l; jet fuel: 10.4 kWh/l; petrol: 9.7 kWh/l. When looking up calorific values, you’ll find “gross calorific value” and “net calorific value” listed (also known as “high heat value” and “low heat value”). These differ by only 6% for motor fuels, so it’s not crucial to distinguish them here, but let me explain anyway. The gross calorific value is the actual chemical energy released when the fuel is burned. One of the products of combustion is water, and in most engines and power stations, part of the energy goes into vaporizing this water. The net calorific value measures how much energy is left over assuming this energy of vaporization is discarded and wasted. When we ask “how much energy does my lifestyle consume?” the gross calorific value is the right quantity to use. The net calorific value, on the other hand, is of interest to a power station engineer, who needs to decide which fuel to burn in his power station. Throughout this book I’ve tried to use gross calorific values. A final note for party-pooping pedants who say “butter is not a hydrocarbon”: OK, butter is not a pure hydrocarbon; but it’s a good approximation to say that the main component of butter is long hydrocarbon chains, just like petrol. The proof of the pudding is, this approximation got us within 30% of the correct answer. Welcome to guerrilla physics.↩