26 Fluctuations and storage
The wind, as a direct motive power, is wholly inapplicable to a system of machine labour, for during a calm season the whole business of the country would be thrown out of gear. Before the era of steam-engines, windmills were tried for draining mines; but though they were powerful machines, they were very irregular, so that in a long tract of calm weather the mines were drowned, and all the workmen thrown idle.
William Stanley Jevons, 1865
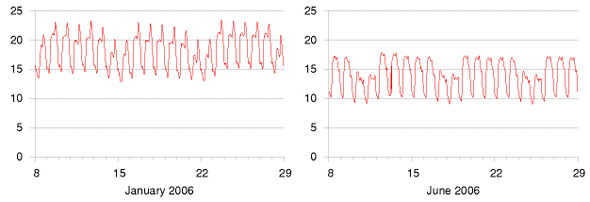
If we kick fossil fuels and go all-out for renewables, or all-out for nuclear, or a mixture of the two, we may have a problem. Most of the big renewables are not turn-off-and-onable. When the wind blows and the sun comes out, power is there for the taking; but maybe two hours later, it’s not available any more. Nuclear power stations are not usually designed to be turn-off-and-onable either. They are usually on all the time, and their delivered power can be turned down and up only on a timescale of hours. This is a problem because, on an electricity network, consumption and production must be exactly equal all the time. The electricity grid can’t store energy. To have an energy plan that adds up every minute of every day, we therefore need something easily turn-off-and-onable. It’s commonly assumed that the easily turn-off-and-onable something should be a source of power that gets turned off and on to compensate for the fluctuations of supply relative to demand (for example, a fossil fuel power station!). But another equally effective way to match supply and demand would be to have an easily turn-off-and-onable demand for power – a sink of power that can be turned off and on at the drop of a hat.
Either way, the easily turn-off-and-onable something needs to be a big something because electricity demand varies a lot (figure 26.1). The demand sometimes changes significantly on a timescale of a few minutes. This chapter discusses how to cope with fluctuations in supply and demand, without using fossil fuels.
How much do renewables fluctuate?
However much we love renewables, we must not kid ourselves about the fact that wind does fluctuate.
Critics of wind power say: “Wind power is intermittent and unpredictable, so it can make no contribution to security of supply; if we create lots of wind power, we’ll have to maintain lots of fossil-fuel power plant to replace the wind when it drops.” Headlines such as “Loss of wind causes Texas power grid emergency” reinforce this view. 1 Supporters of wind energy play down this problem: “Don’t worry – individual wind farms may be intermittent, but taken together, the sum of all wind farms in different locations is much less intermittent.” 2
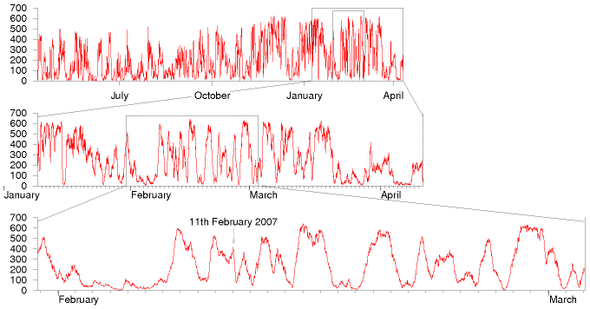
Let’s look at real data and try to figure out a balanced viewpoint. Figure 26.2 shows the summed output of the wind fleet of the Republic of Ireland from April 2006 to April 2007. 3 Clearly wind is intermittent, even if we add up lots of turbines covering a whole country. The UK is a bit larger than Ireland, but the same problem holds there too. 4 Between October 2006 and February 2007 there were 17 days when the output from Britain’s 1632 windmills was less than 10% of their capacity. During that period there were five days when output was less than 5% and one day when it was only 2%.

Let’s quantify the fluctuations in country-wide wind power. The two issues are short-term changes, and long-term lulls. Let’s find the fastest short-term change in a month of Irish wind data. On 11th February 2007, the Irish wind power fell steadily from 415 MW at midnight to 79 MW at 4am. That’s a slew rate of 84 MW per hour for a country-wide fleet of capacity 745 MW. (By slew rate I mean the rate at which the delivered power fell or rose – the slope of the graph on 11th February.) OK: if we scale British wind power up to a capacity of 33 GW (so that it delivers 10 GW on average), we can expect to have occasional slew rates of
[\text{84\ MW/h~} \times \ \frac{\text{33\ 000\ MW}}{\text{745\ MW}}\ = \text{~3700\ MW/h,}]
assuming Britain is like Ireland. So we need to be able to either power up replacements for wind at a rate of 3.7 GW per hour – that’s 4 nuclear power stations going from no power to full power every hour, say – or we need to be able to suddenly turn down our demand at a rate of 3.7 GW per hour.
Could these windy demands be met? In answering this question we’ll need to talk more about “gigawatts.” Gigawatts are big country-sized units of power. They are to a country what a kilowatt-hour-per-day is to a person: a nice convenient unit. The UK’s average electricity consumption is about 40 GW. We can relate this national number to personal consumption: 1 kWh per day per person is equivalent to 2.5 GW nationally. So if every person uses 16 kWh per day of electricity, then national consumption is 40 GW.
Is a national slew-rate of 4 GW per hour completely outside human experience? No. Every morning, as figure 26.3 shows, British demand climbs by about 13 GW between 6.30am and 8.30am. That’s a slew rate of 6.5 GW per hour. So our power engineers already cope, every day, with slew rates bigger than 4GW per hour on the national grid. An extra occasional slew of 4 GW per hour induced by sudden wind variations is no reasonable cause for ditching the idea of country-sized wind farms. It’s a problem just like problems that engineers have already solved. We simply need to figure out how to match ever-changing supply and demand in a grid with no fossil fuels. I’m not saying that the wind-slew problem is already solved – just that it is a problem of the same size as other problems that have been solved.
OK, before we start looking for solutions, we need to quantify wind’s other problem: long-term lulls. At the start of February 2007, Ireland had a country-wide lull that lasted five days. This was not an unusual event, as you can see in figure 26.2. Lulls lasting two or three days happen several times a year.
There are two ways to get through lulls. Either we can store up energy somewhere before the lull, or we need to have a way of reducing demand during the entire lull. (Or a mix of the two.) If we have 33 GW of wind turbines delivering an average power of 10 GW then the amount of energy we must either store up in advance or do without during a five-day lull is
10 GW × (5 × 24 h) = 1200 GWh.
(The gigawatt-hour (GWh) is the cuddly energy unit for nations. Britain’s electricity consumption is roughly 1000 GWh per day.)
To personalize this quantity, an energy store of 1200 GWh for the nation is equivalent to an energy store of 20 kWh per person. Such an energy store would allow the nation to go without 10 GW of electricity for 5 days; or equivalently, every individual to go without 4 kWh per day of electricity for 5 days.
Coping with lulls and slews
We need to solve two problems – lulls (long periods with small renewable production), and slews (short-term changes in either supply or demand). We’ve quantified these problems, assuming that Britain had roughly 33 GW of wind power. To cope with lulls, we must effectively store up roughly 1200 GWh of energy (20 kWh per person). The slew rate we must cope with is 6.5 GW per hour (or 0.1 kW per hour per person).
There are two solutions, both of which could scale up to solve these problems. The first solution is a centralized solution, and the second is decentralized. The first solution stores up energy, then copes with fluctuations by turning on and off a source powered from the energy store. The second solution works by turning on and off a piece of demand.
The first solution is pumped storage. The second uses the batteries of the electric vehicles that we discussed in Chapter 20. Before I describe these solutions, let’s discuss a few other ideas for coping with slew.
Other supply-side ways of coping with slew
Some of the renewables are turn-off-and-onable. If we had a lot of renewable power that was easily turn-off-and-onable, all the problems of this chapter would go away. Countries like Norway and Sweden have large and deep hydroelectric supplies which they can turn on and off. What might the options be in Britain?
First, Britain could have lots of waste incinerators and biomass incinerators – power stations playing the role that is today played by fossil power stations. If these stations were designed to be turn-off-and-onable, there would be cost implications, just as there are costs when we have extra fossil power stations that are only working part-time: their generators would sometimes be idle and sometimes work twice as hard; and most generators aren’t as efficient if you keep turning them up and down, compared with running them at a steady speed. OK, leaving cost to one side, the crucial question is how big a turn-off-and-onable resource we might have. If all municipal waste were incinerated, and an equal amount of agricultural waste were incinerated, then the average power from these sources would be about 3 GW. If we built capacity equal to twice this power, making incinerators capable of delivering 6 GW, and thus planning to have them operate only half the time, these would be able to deliver 6 GW throughout periods of high demand, then zero in the wee hours. These power stations could be designed to switch on or off within an hour, thus coping with slew rates of 6 GW per hour – but only for a maximum slew range of 6 GW! That’s a helpful contribution, but not enough slew range in itself, if we are to cope with the fluctuations of 33 GW of wind.
What about hydroelectricity? Britain’s hydroelectric stations have an average load factor of 20% so they certainly have the potential to be turned on and off. Furthermore, hydro has the wonderful feature that it can be turned on and off very quickly. Glendoe, a new hydro station with a capacity of 100 MW, will be able to switch from off to on in 30 seconds, for example. That’s a slew rate of 12 GW per hour in just one power station! So a sufficiently large fleet of hydro power stations should be able to cope with the slew introduced by enormous wind farms. However, the capacity of the British hydro fleet is not currently big enough to make much contribution to our slew problem (assuming we want to cope with the rapid loss of say 10 or 33 GW of wind power). The total capacity of traditional hydroelectric stations in Britain is only about 1.5 GW.
So simply switching on and off other renewable power sources is not going to work in Britain. We need other solutions.
Pumped storage
Pumped storage systems use cheap electricity to shove water from a downhill lake to an uphill lake; then regenerate electricity when it’s valuable, using turbines just like the ones in hydroelectric power stations.
| station | power (GW) | head (m) | volume (million m3) | energy stored (GWh) |
|---|---|---|---|---|
| Ffestiniog | 0.36 | 320–295 | 1.7 | 1.3 |
| Cruachan | 0.40 | 365–334 | 11.3 | 10 |
| Foyers | 0.30 | 178–172 | 13.6 | 6.3 |
| Dinorwig | 1.80 | 542–494 | 6.7 | 9.1 |
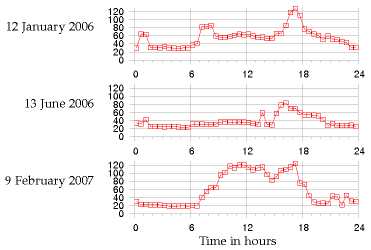
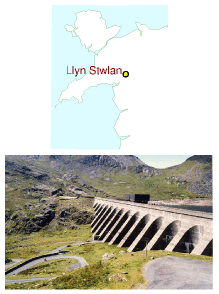
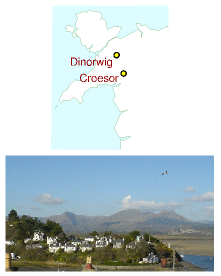
Britain has four pumped storage facilities, which can store 30 GWh between them (table 26.4, figure 26.6). They are typically used to store excess electricity at night, then return it during the day, especially at moments of peak demand – a profitable business, as figure 26.5 shows. The Dinorwig power station – an astonishing cathedral inside a mountain in Snowdonia – also plays an insurance role: it has enough oomph to restart the national grid in the event of a major failure. Dinorwig can switch on, from 0 to 1.3 GW power, in 12 seconds.
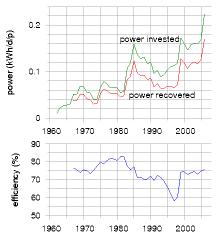
Dinorwig is the Queen of the four facilities. Let’s review her vital statistics. The total energy that can be stored in Dinorwig is about 9 GWh. Its upper lake is about 500 m above the lower, and the working volume of 7 million m3 flows at a maximum rate of 390 m3/s, allowing power delivery at 1.7 GW for 5 hours. The efficiency of this storage system is 75%. 5
If all four pumped storage stations are switched on simultaneously, they can produce a power of 2.8 GW. They can switch on extremely fast, coping with any slew rate that demand-fluctuations or wind-fluctuations could come up with. However the capacity of 2.8 GW is not enough to replace 10 GW or 33 GW of wind power if it suddenly went missing. Nor is the total energy stored (30 GWh) anywhere near the 1200 GWh we are interested in storing in order to make it through a big lull. Could pumped storage be ramped up? Can we imagine solving the entire lull problem using pumped storage alone?
Can we store 1200 GWh?
We are interested in making much bigger storage systems, storing a total of 1200 GWh (about 130 times what Dinorwig stores). And we’d like the capacity to be about 20 GW – about ten times bigger than Dinorwig’s. So here is the pumped storage solution: we have to imagine creating roughly 12 new sites, each storing 100 GWh – roughly ten times the energy stored in Dinorwig. The pumping and generating hardware at each site would be the same as Dinorwig’s.
Ways to store 100 GWh
drop from upper lake
working volume required (million m3)
example size of lake area × depth
500 m
80
2 km2 × 40 m
500 m
80
4 km2 × 20 m
200 m
200
5 km2 × 40 m
200 m
200
10 km2 × 20 m
100 m
400
10 km2 × 40 m
100 m
400
20 km2 × 20 m
Table 26.7. Pumped storage. Ways to store 100 GWh. For comparison with column 2, the working volume of Dinorwig is 7 million m3, and the volume of Lake Windermere is 300 million m3. For comparison with column 3, Rutland water has an area of 12.6 km2; Grafham water 7.4 km2. Carron valley reservoir is 3.9 km2. The largest lake in Great Britain is Loch Lomond, with an area of 71 km2. [^6]Assuming the generators have an efficiency of 90%, table 26.7 shows a few ways of storing 100 GWh, for a range of height drops. (For the physics behind this table, see this chapter’s endnotes.)
Is it plausible that twelve such sites could be found? Certainly, we could build several more sites like Dinorwig in Snowdonia alone. Table 26.8 shows two alternative sites near to Ffestiniog where two facilities equal to Dinorwig could have been built. These sites were considered alongside Dinorwig in the 1970s, and Dinorwig was chosen.
| proposed location | power (GW) | head (m) | volume (million m3) | energy stored (GWh) |
|---|---|---|---|---|
| Bowydd | 2.40 | 250 | 17.7 | 12.0 |
| Croesor | 1.35 | 310 | 8.0 | 6.7 |
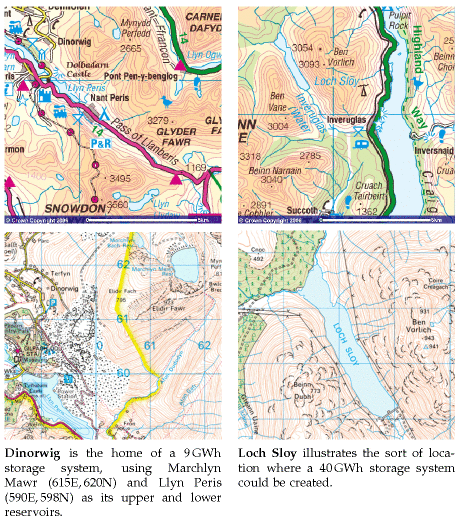
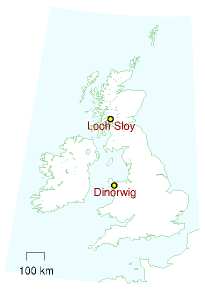
Pumped-storage facilities holding significantly more energy than Dinorwig could be built in Scotland by upgrading existing hydroelectric facilities. Scanning a map of Scotland, one candidate location would use Loch Sloy as its upper lake and Loch Lomond as its lower lake. There is already a small hydroelectric power station linking these lakes. Figure 26.9 shows these lakes and the Dinorwig lakes on the same scale. The height difference between Loch Sloy and Loch Lomond is about 270 m. Sloy’s area is about 1.5 km2, and it can already store an energy of 20 GWh. If Loch Sloy’s dam were raised by another 40 m then the extra energy that could be stored would be about 40 GWh. The water level in Loch Lomond would change by at most 0.8 m during a cycle. This is less than the normal range of annual water level variations of Loch Lomond (2 m).
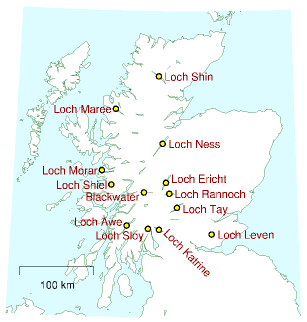
Figure 26.10 shows 13 locations in Scotland with potential for pumped storage. (Most of them already have a hydroelectric facility.) If ten of these had the same potential as I just estimated for Loch Sloy, then we could store 400 GWh 8 – one third of the total of 1200 GWh that we were aiming for.
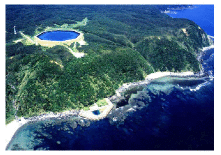
We could scour the map of Britain for other locations. The best locations would be near to big wind farms. One idea would be to make a new artificial lake in a hanging valley (across the mouth of which a dam would be built) terminating above the sea, with the sea being used as the lower lake.
Thinking further outside the box, one could imagine getting away from lakes and reservoirs, putting half of the facility in an underground chamber. A pumped-storage chamber one kilometre below London has been mooted.
By building more pumped storage systems, it looks as if we could increase our maximum energy store from 30 GWh to 100 GWh or perhaps 400 GWh. Achieving the full 1200 GWh that we were hoping for looks tough, however. Fortunately there is another solution.
Demand management using electric vehicles
To recap our requirements: we’d like to be able to store or do without about 1200 GWh, which is 20 kWh per person; and to cope with swings in supply of up to 33 GW – that’s 0.5 kW per person. These numbers are delightfully similar in size to the energy and power requirements of electric cars. The electric cars we saw in Chapter 20 had energy stores of between 9 kWh and 53 kWh. A national fleet of 30 million electric cars would store an energy similar to 20 kWh per person! Typical battery chargers draw a power of 2 or 3 kW. So simultaneously switching on 30 million battery chargers would create a change in demand of about 60 GW! The average power required to power all the nation’s transport, if it were all electric, is roughly 40 or 50 GW. There’s therefore a close match between the adoption of electric cars proposed in Chapter 20 and the creation of roughly 33 GW of wind capacity, delivering 10 GW of power on average.
Here’s one way this match could be exploited: electric cars could be plugged in to smart chargers, at home or at work. These smart chargers would be aware both of the value of electricity, and of the car user’s requirements (for example, “my car must be fully charged by 7am on Monday morning”). The charger would sensibly satisfy the user’s requirements by guzzling electricity whenever the wind blows, and switching off when the wind drops, or when other forms of demand increase. These smart chargers would provide a useful service in balancing to the grid, a service which could be rewarded financially.
We could have an especially robust solution if the cars’ batteries were exchangeable. Imagine popping in to a filling station and slotting in a set of fresh batteries in exchange for your exhausted batteries. The filling station would be responsible for recharging the batteries; they could do this at the perfect times, turning up and down their chargers so that total supply and demand were always kept in balance. Using exchangeable batteries is an especially robust solution because there could be millions of spare batteries in the filling stations’ storerooms. These spare batteries would provide an extra buffer to help us get through wind lulls. Some people say, “Horrors! How could I trust the filling station to look after my batteries for me? What if they gave me a duff one?” Well, you could equally well ask today “What if the filling station gave me petrol laced with water?” Myself, I’d much rather use a vehicle maintained by a professional than by a muppet like me!
Let’s recap our options. We can balance fluctuating demand and fluctuating supply by switching on and off power generators (waste incinerators and hydroelectric stations, for example); by storing energy somewhere and regenerating it when it’s needed; or by switching demand off and on.
The most promising of these options, in terms of scale, is switching on and off the power demand of electric-vehicle charging. 30 million cars, with 40 kWh of associated batteries each (some of which might be exchangeable batteries sitting in filling stations) adds up to 1200 GWh. If freight delivery were electrified too then the total storage capacity would be bigger still.
There is thus a beautiful match between wind power and electric vehicles. If we ramp up electric vehicles at the same time as ramping up wind power, roughly 3000 new vehicles for every 3 MW wind turbine, and if we ensure that the charging systems for the vehicles are smart, this synergy would go a long way to solving the problem of wind fluctuations. If my prediction about hydrogen vehicles is wrong, and hydrogen vehicles turn out to be the low-energy vehicles of the future, then the wind-with-electric-vehicles match-up that I’ve just described could of course be replaced by a wind-with-hydrogen match-up. The wind turbines would make electricity; and whenever electricity was plentiful, hydrogen would be produced and stored in tanks, for subsequent use in vehicles or in other applications, such as glass production.
Other demand-management and storage ideas
There are a few other demand-management and energy-storage options, which we’ll survey now.
The idea of modifying the rate of production of stuff to match the power of a renewable source is not new. Many aluminium production plants are located close to hydroelectric power stations; the more it rains, the more aluminium is produced. Wherever power is used to create stuff that is storable, there’s potential for switching that power-demand on and off in a smart way. For example, reverse-osmosis systems (which make pure water from sea-water – see chapter 15) are major power consumers in many countries (though not Britain). Another storable product is heat. If, as suggested in Chapter 21, we electrify buildings’ heating and cooling systems, especially water-heating and air-heating, then there’s potential for lots of easily-turn-off-and-onable power demand to be attached to the grid. Well-insulated buildings hold their heat for many hours, so there’s flexibility in the timing of their heating. Moreover, we could include large thermal reservoirs in buildings, and use heat-pumps to pump heat into or out of those reservoirs at times of electricity abundance; then use a second set of heat pumps to deliver heat or cold from the reservoirs to the places where heating or cooling are wanted.
Controlling electricity demand automatically would be easy. The simplest way to do this is to have devices such as fridges and freezers listen to the frequency of the mains. When there is a shortage of power on the grid, the frequency drops below its standard value of 50 Hz; when there is a power excess, the frequency rises above 50 Hz. (It’s just like a dynamo on a bicycle: when you switch the lights on, you have to pedal harder to supply the extra power; if you don’t then the bike goes a bit slower.) Fridges can be modified to nudge their internal thermostats up and down just a little in response to the mains frequency, 9 in such a way that, without ever jeopardizing the temperature of your butter, they tend to take power at times that help the grid.
Can demand-management provide a significant chunk of virtual storage? How big a sink of power are the nation’s fridges? On average, a typical fridge-freezer draws about 18 W; let’s guess that the number of fridges is about 30million. So the ability to switch off all the nation’s fridges for a few minutes would be equivalent to 0.54 GW of automatic adjustable power. This is quite a lot of electrical power – more than 1% of the national total – and it is similar in size to the sudden increases in demand produced when the people, united in an act of religious observance (such as watching EastEnders), simultaneously switch on their kettles. Such “TV pick-ups” typically produce increases of demand of 0.6–0.8 GW. Automatically switching off every fridge would nearly cover these daily blips of concerted kettle boiling. These smart fridges could also help iron out short-time-scale fluctuations in wind power. The TV pick-ups associated with the holiest acts of observance (for example, watching England play footie against Sweden) can produce sudden increases in demand of over 2 GW. On such occasions, electricity demand and supply are kept in balance by unleashing the full might of Dinorwig.
To provide flexibility to the electricity-grid’s managers, who perpetually turn power stations up and down to match supply to demand, many industrial users of electricity are on special contracts that allow the managers to switch off those users’ demand at very short notice. In South Africa (where there are frequent electricity shortages), radio-controlled demand-management systems are being installed in hundreds of thousands of homes, to control air-conditioning systems and electric water heaters. 10
Denmark’s solution
Here’s how Denmark copes with the intermittency of its wind power. The Danes effectively pay to use other countries’ hydroelectric facilities as storage facilities. Almost all of Denmark’s wind power is exported to its European neighbours, 11 some of whom have hydroelectric power, which they can turn down to balance things out. The saved hydroelectric power is then sold back to the Danes (at a higher price) during the next period of low wind and high demand. Overall, Danish wind is contributing useful energy, and the system as a whole has considerable security thanks to the capacity of the hydro system.
Could Britain adopt the Danish solution? We would need direct large-capacity connections to countries with lots of turn-off-and-onable hydroelectric capacity; or a big connection to a Europe-wide electricity grid.
Norway has 27.5 GW of hydroelectric capacity. Sweden has roughly 16 GW. And Iceland has 1.8 GW. A 1.2 GW high-voltage DC interconnector to Norway was mooted in 2003, but not built. A connection to the Netherlands – the BritNed interconnector, with a capacity of 1 GW – will be built in 2010. Denmark’s wind capacity is 3.1 GW, and it has a 1 GW connection to Norway, 0.6 GW to Sweden, and 1.2 GW to Germany, a total export capacity of 2.8 GW, very similar to its wind capacity. To be able to export all its excess wind power in the style of Denmark, Britain (assuming 33 GW of wind capacity) would need something like a 10 GW connection to Norway, 8 GW to Sweden, and 1 GW to Iceland.
A solution with two grids
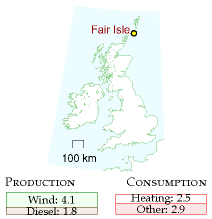
A radical approach is to put wind power and other intermittent sources onto a separate second electricity grid, used to power systems that don’t require reliable power, such as heating and electric vehicle battery-charging. For over 25 years (since 1982), 12 the Scottish island of Fair Isle (population 70, area 5.6 km2) has had two electricity networks that distribute power from two wind turbines and, if necessary, a diesel-powered electricity generator. Standard electricity service is provided on one network, and electric heating is delivered by a second set of cables. The electric heating is mainly served by excess electricity from the wind-turbines that would otherwise have had to be dumped. Remote frequency-sensitive programmable relays control individual water heaters and storage heaters in the individual buildings of the community. The mains frequency is used to inform heaters when they may switch on. In fact there are up to six frequency channels per household, so the system emulates seven grids. Fair Isle also successfully trialled a kinetic-energy storage system (a flywheel) to store energy during fluctuations of wind strength on a time-scale of 20 seconds.
Electrical vehicles as generators
If 30 million electric vehicles were willing, in times of national electricity shortage, to run their chargers in reverse and put power back into the grid, then, at 2 kW per vehicle, we’d have a potential power source of 60 GW – similar to the capacity of all the power stations in the country. Even if only one third of the vehicles were connected and available at one time, they’d still amount to a potential source of 20 GW of power. If each of those vehicles made an emergency donation of 2 kWh of energy – corresponding to perhaps 20% of its battery’s energy-storage capacity – then the total energy provided by the fleet would be 20 GWh – twice as much as the energy in the Dinorwig pumped storage facility.
Other storage technologies
There are lots of ways to store energy, and lots of criteria by which storage solutions are judged. Figure 26.13 shows three of the most important criteria: energy density (how much energy is stored per kilogram of storage system); efficiency (how much energy you get back per unit energy put in); and lifetime (how many cycles of energy storage can be delivered before the system needs refurbishing). Other important criteria are: the maximum rate at which energy can be pumped into or out of the storage system, often expressed as a power per kg; the duration for which energy stays stored in the system; and of course the cost and safety of the system.
Figure 26.13. Some properties of storage systems and fuels. (a) Energy density (on a logarithmic scale) versus lifetime (number of cycles). (b) Energy density versus efficiency. The energy densities don’t include the masses of the energy systems’ containers, except in the case of "air" (compressed air storage). Taking into account the weight of a cryogenic tank for holding hydrogen, the energy density of hydrogen is reduced from 39 000Wh/kg to roughly 2400 Wh/kg. [^13]fuel
calorific value
(kWh/kg)
(MJ/l)
propane
13.8
25.4
petrol
13.0
34.7
diesel oil (DERV)
12.7
37.9
kerosene
12.8
37.0
heating oil
12.8
37.3
ethanol
8.2
23.4
methanol
5.5
18.0
bioethanol
21.6
coal
8.0
firewood
4.4
hydrogen
39.0
natural gas
14.85
0.04
(a)
battery type
energy density (Wh/kg)
lifetime (cycles)
nickel-cadmium
45–80
1500
NiMH
60–120
300–500
lead-acid
30–50
200–300
lithium-ion
110–160
300–500
lithium-ion-polymer
100–130
300–500
reusable alkaline
80
50
(b)
Table 26.14. (a) Calorific values (energy densities, per kg and per litre) of some fuels (in kWh per kg and MJ per litre). (b) Energy density of some batteries (in Wh per kg). 1 kWh = 1000Wh. [^14]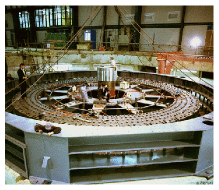
Flywheels
Figure 26.15 shows a monster flywheel used to supply brief bursts of power of up to 0.4 GW to power an experimental facility. It weighs 800 t. Spinning at 225 revolutions per minute, it can store 1000 kWh, and its energy density is about 1 Wh per kg.
A flywheel system designed for energy storage in a racing car can store 400 kJ (0.1 kWh) of energy and weighs 24 kg (p126). That’s an energy density of 4.6 Wh per kg.
High-speed flywheels made of composite materials have energy densities up to 100 Wh/kg.
Supercapacitors
Supercapacitors are used to store small amounts of electrical energy (up to 1 kWh) where many cycles of operation are required, and charging must be completed quickly. For example, supercapacitors are favoured over batteries for regenerative braking in vehicles that do many stops and starts. You can buy supercapacitors with an energy density of 6 Wh/kg.
A US company, EEStor, claims to be able to make much better supercapacitors, using barium titanate, with an energy density of 280 Wh/kg.
Vanadium flow batteries
VRB power systems 15 have provided a 12 MWh energy storage system for the Sorne Hill wind farm in Ireland, whose current capacity is “32 MW,” increasing to “39 MW.” (VRB stands for vanadium redox battery.) This storage system is a big “flow battery,” a redox regenerative fuel cell, with a couple of tanks full of vanadium in different chemical states. This storage system can smooth the output of its wind farm on a time-scale of minutes, but the longest time for which it could deliver one third of the capacity (during a lull in the wind) is one hour.
A 1.5 MWh vanadium system costing $480 000 occupies 70 m2 with a mass of 107 tons. The vanadium redox battery has a life of more than 10 000 cycles. It can be charged at the same rate that it is discharged (in contrast to lead-acid batteries which must be charged 5 times as slowly). Its efficiency is 70–75%, round-trip. The volume required is about 1 m3 of 2-molar vanadium in sulphuric acid to store 20 kWh. (That’s 20 Wh/kg.)
So to store 10 GWh would require 500 000 m3 (170 swimming pools) – for example, tanks 2 m high covering a floor area of 500 m × 500 m.
Scaling up the vanadium technology to match a big pumped-storage system – 10 GWh – might have a noticeable effect on the world vanadium market, but there is no long-term shortage of vanadium. Current worldwide production of vanadium is 40 000 tons per year. A 10 GWh system would contain 36 000 tons of vanadium – about one year’s worth of current production. Vanadium is currently produced as a by-product of other processes, and the total world vanadium resource is estimated to be 63 million tons.
“Economical” solutions
In the present world which doesn’t put any cost on carbon pollution, the financial bar that a storage system must beat is an ugly alternative: storage can be emulated by simply putting up an extra gas-fired power station to meet extra demand, and shedding any excess electrical power by throwing it away in heaters.
Seasonal fluctuations
Figure 26.16. Gas demand (lower graph) and temperature (upper graph) in Britain during 2007.The fluctuations of supply and demand that have the longest timescale are seasonal. The most important fluctuation is that of building-heating, which goes up every winter. Current UK natural gas demand varies throughout the year, from a typical average of 36 kWh/d per person in July and August to an average of 72 kWh/d per person in December to February, with extremes of 30–80 kWh/d/p (figure 26.16).
Some renewables also have yearly fluctuations – solar power is stronger in summer and wind power is weaker.
How to ride through these very-long-timescale fluctuations? Electric vehicles and pumped storage are not going to help store the sort of quantities required. A useful technology will surely be long-term thermal storage. A big rock or a big vat of water can store a winter’s worth of heat for a building – Chapter E discusses this idea in more detail. In the Netherlands, summer heat from roads is stored in aquifers until the winter; and delivered to buildings via heat pumps. 16
Notes
V = 100 GWh/(ρghε),
where ρ is the density of water and g is the acceleration of gravity. I assumed the generators have an efficiency of ε = 0.9.
- “Loss of wind causes Texas power grid emergency”. [2l99ht] Actually, my reading of this news article is that this event, albeit unusual, was an example of normal power grid operation. The grid has industrial customers whose supply is interruptible, in the event of a mismatch between supply and demand. Wind output dropped by 1.4 GW at the same time that Texans’ demand increased by 4.4 GW, causing exactly such a mismatch between supply and demand. The interruptible supplies were interrupted. Everything worked as intended. Here is another example, where better power-system planning would have helped: “Spain wind power hits record, cut ordered.” [3x2kvv] Spain’s average electricity consumption is 31 GW. On Tuesday 4th March 2008, its wind generators were delivering 10 GW. “Spain’s power market has become particularly sensitive to fluctuations in wind.”↩
- Supporters of wind energy play down this problem: “Don’t worry – individual wind farms may be intermittent, but taken together, the sum of all wind farms is much less intermittent.” For an example, see the website yes2wind.com, which, on its page “debunking the myth that wind power isn’t reliable” asserts that “the variation in output from wind farms distributed around the country is scarcely noticeable.” www.yes2wind.com/intermittency_debunk.html↩
- The total output of the wind fleet of the Republic of Ireland. Data from eirgrid.com [2hxf6c].↩
- …wind is intermittent, even if we add up lots of turbines covering a whole country. The UK is a bit larger than Ireland, but the same problem holds there too. Source: Oswald et al. (2008).↩
- Dinorwig’s pumped-storage efficiency is 75%. Figure 26.17 shows data. Further information about Dinorwig and the alternate sites for pumped storage: Baines et al. (1983, 1986).↩
- If ten Scottish pumped storage facilities had the same potential as Loch Sloy, then we could store 400 GWh. This rough estimate is backed up by a study by Strathclyde University [5o2xgu] which lists 14 sites having an estimated storage capacity of 514 GWh.↩
- Fridges can be modified to nudge their internal thermostats up and down … in response to the mains frequency. [2n3pmb] Further links: Dynamic Demand www.dynamicdemand.co.uk; www.rltec.com; www.responsiveload.com.↩
- In South Africa… demand-management systems are being installed. Source: [2k8h4o]↩
- Almost all of Denmark’s wind power is exported to its European neighbours. Source: Sharman (2005).↩
- For over 25 years (since 1982), Fair Isle has had two electricity networks. www.fairisle.org.uk/FIECo/ Wind speeds are between 3 m/s and 16 m/s most of the time; 7 m/s is the most probable speed.↩
- Vanadium flow batteries. Sources: www.vrbpower.com; Ireland wind farm [ktd7a]; charging rate [627ced]; worldwide production [5fasl7].↩
- … summer heat from roads is stored in aquifers… [2wmuw7].↩